iOS - How to Debug Module
The Q2DevApp provides a way to debug your work as you go. It runs in a near-production environment, allowing you to test changes to your module. Beyond that, there are several tools and tips that can help you debug issues effectively.
Using Safari Develop Menu
Make sure Develop mode is enabled in Safari. If it’s not, follow the instructions
here:
👉 Enable Safari Developer Features
A common issue developers run into is with the Tecton JavaScript calls:
If your native modules aren’t opening, it’s usually due to a misspelled method name or incorrect identifier.
Assuming your settings.json is set up correctly, you can use Safari’s developer tools to
debug your JavaScript.
Make sure your settings.json contains enableDevMode set to true like this:
{
  ...
  "enableDevMode": true,
  "modules": []
}
Debugging Steps
While running your simulator or device:
- Open Safari.
- Go to Develop > [Your Simulator or Device].
- Choose the uux URL specified in settings.json.
- Go to the Console tab in Safari.
This allows you to: • Inspect your WebView • Validate whether modules from Mobile Core are available
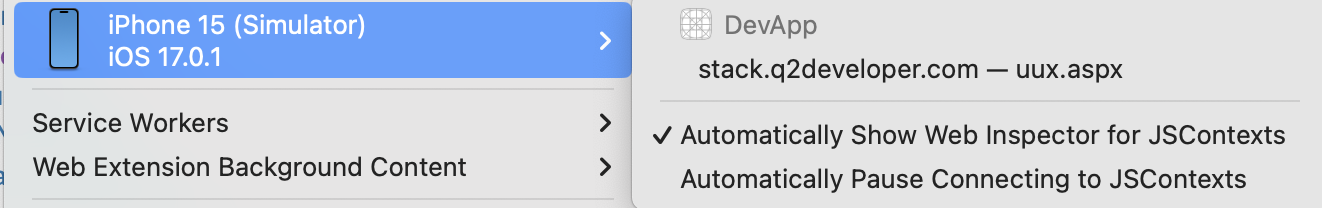
Develop Menu > [Your Simulator or Device]
Choose the uux URL specified in your settings.json file from the list of available
pages.
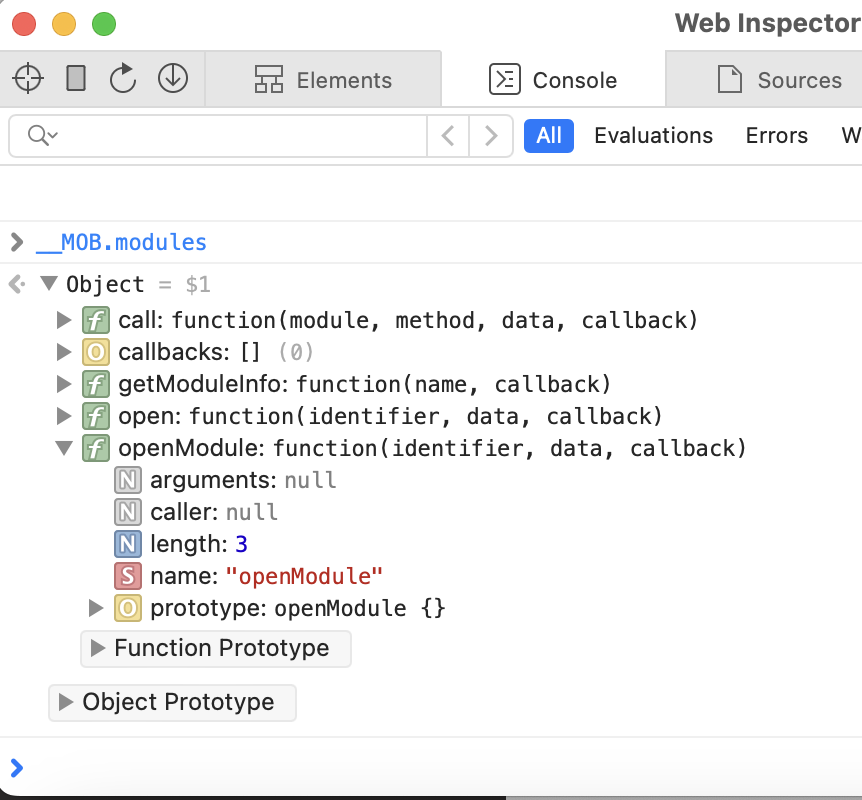
Next, go to the Console tab. This allows you to:
- Inspect your WebView
- Validate whether modules from Mobile Core are available