Android - Module Debugging
The DevApp provides you a way to debug your work as you go. It provides a near production level environment for you to test changes to your module. Beyond that, there are a few other things that can help you debug your issues.
Using Chrome Inspect
A common issue developers run into is the connection between the Tecton callMethod and openModule javascript calls not opening your native modules. Usually this is caused by a misspelling, wrong classPath, or wrong identifier being used.
Assuming your settings.json is setup correctly, we can use chrome debugging tools to debug our javascript.
While running your emulator, open your chrome browser and navigate to chrome://inspect/#devices
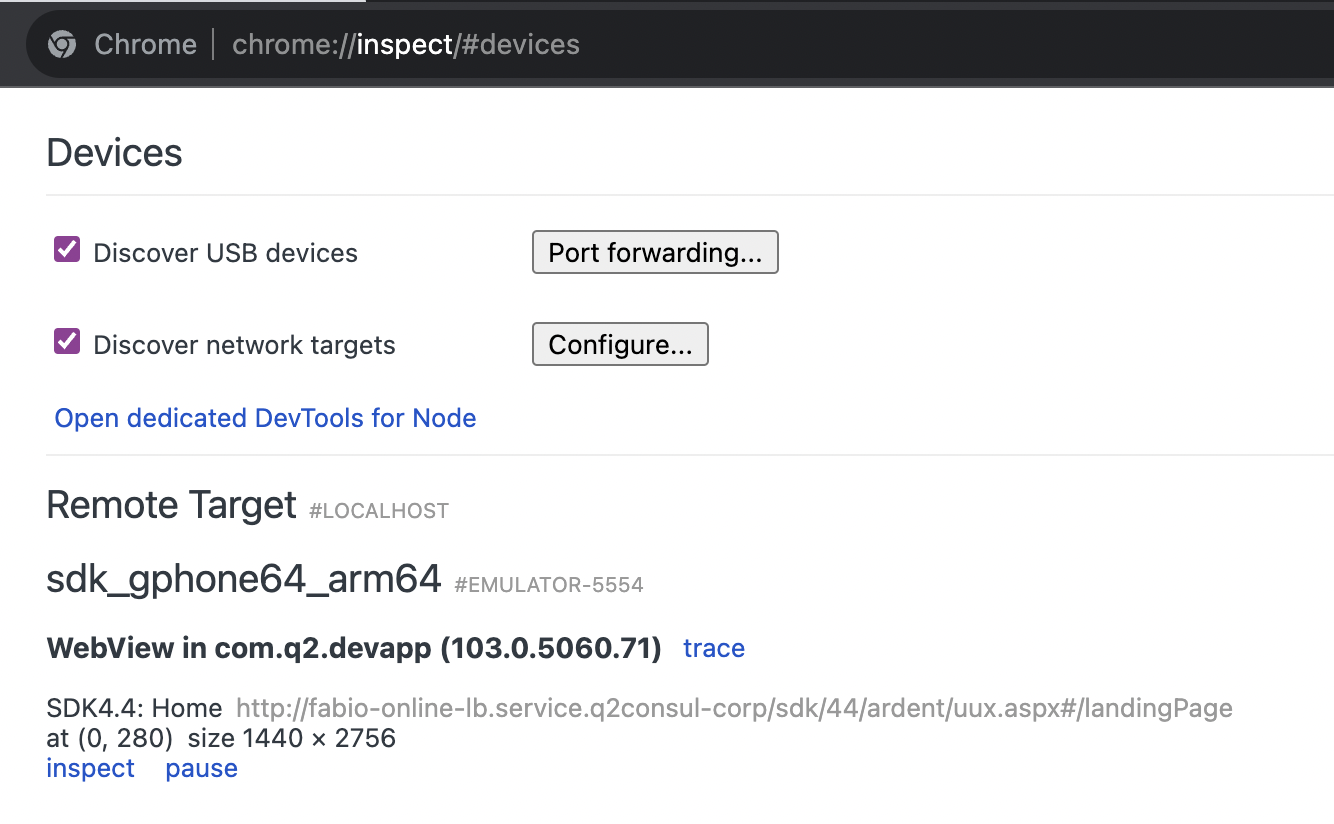
Click the inspect button for the webview. It will open an inspection tool you can use to interact with the webview directly.
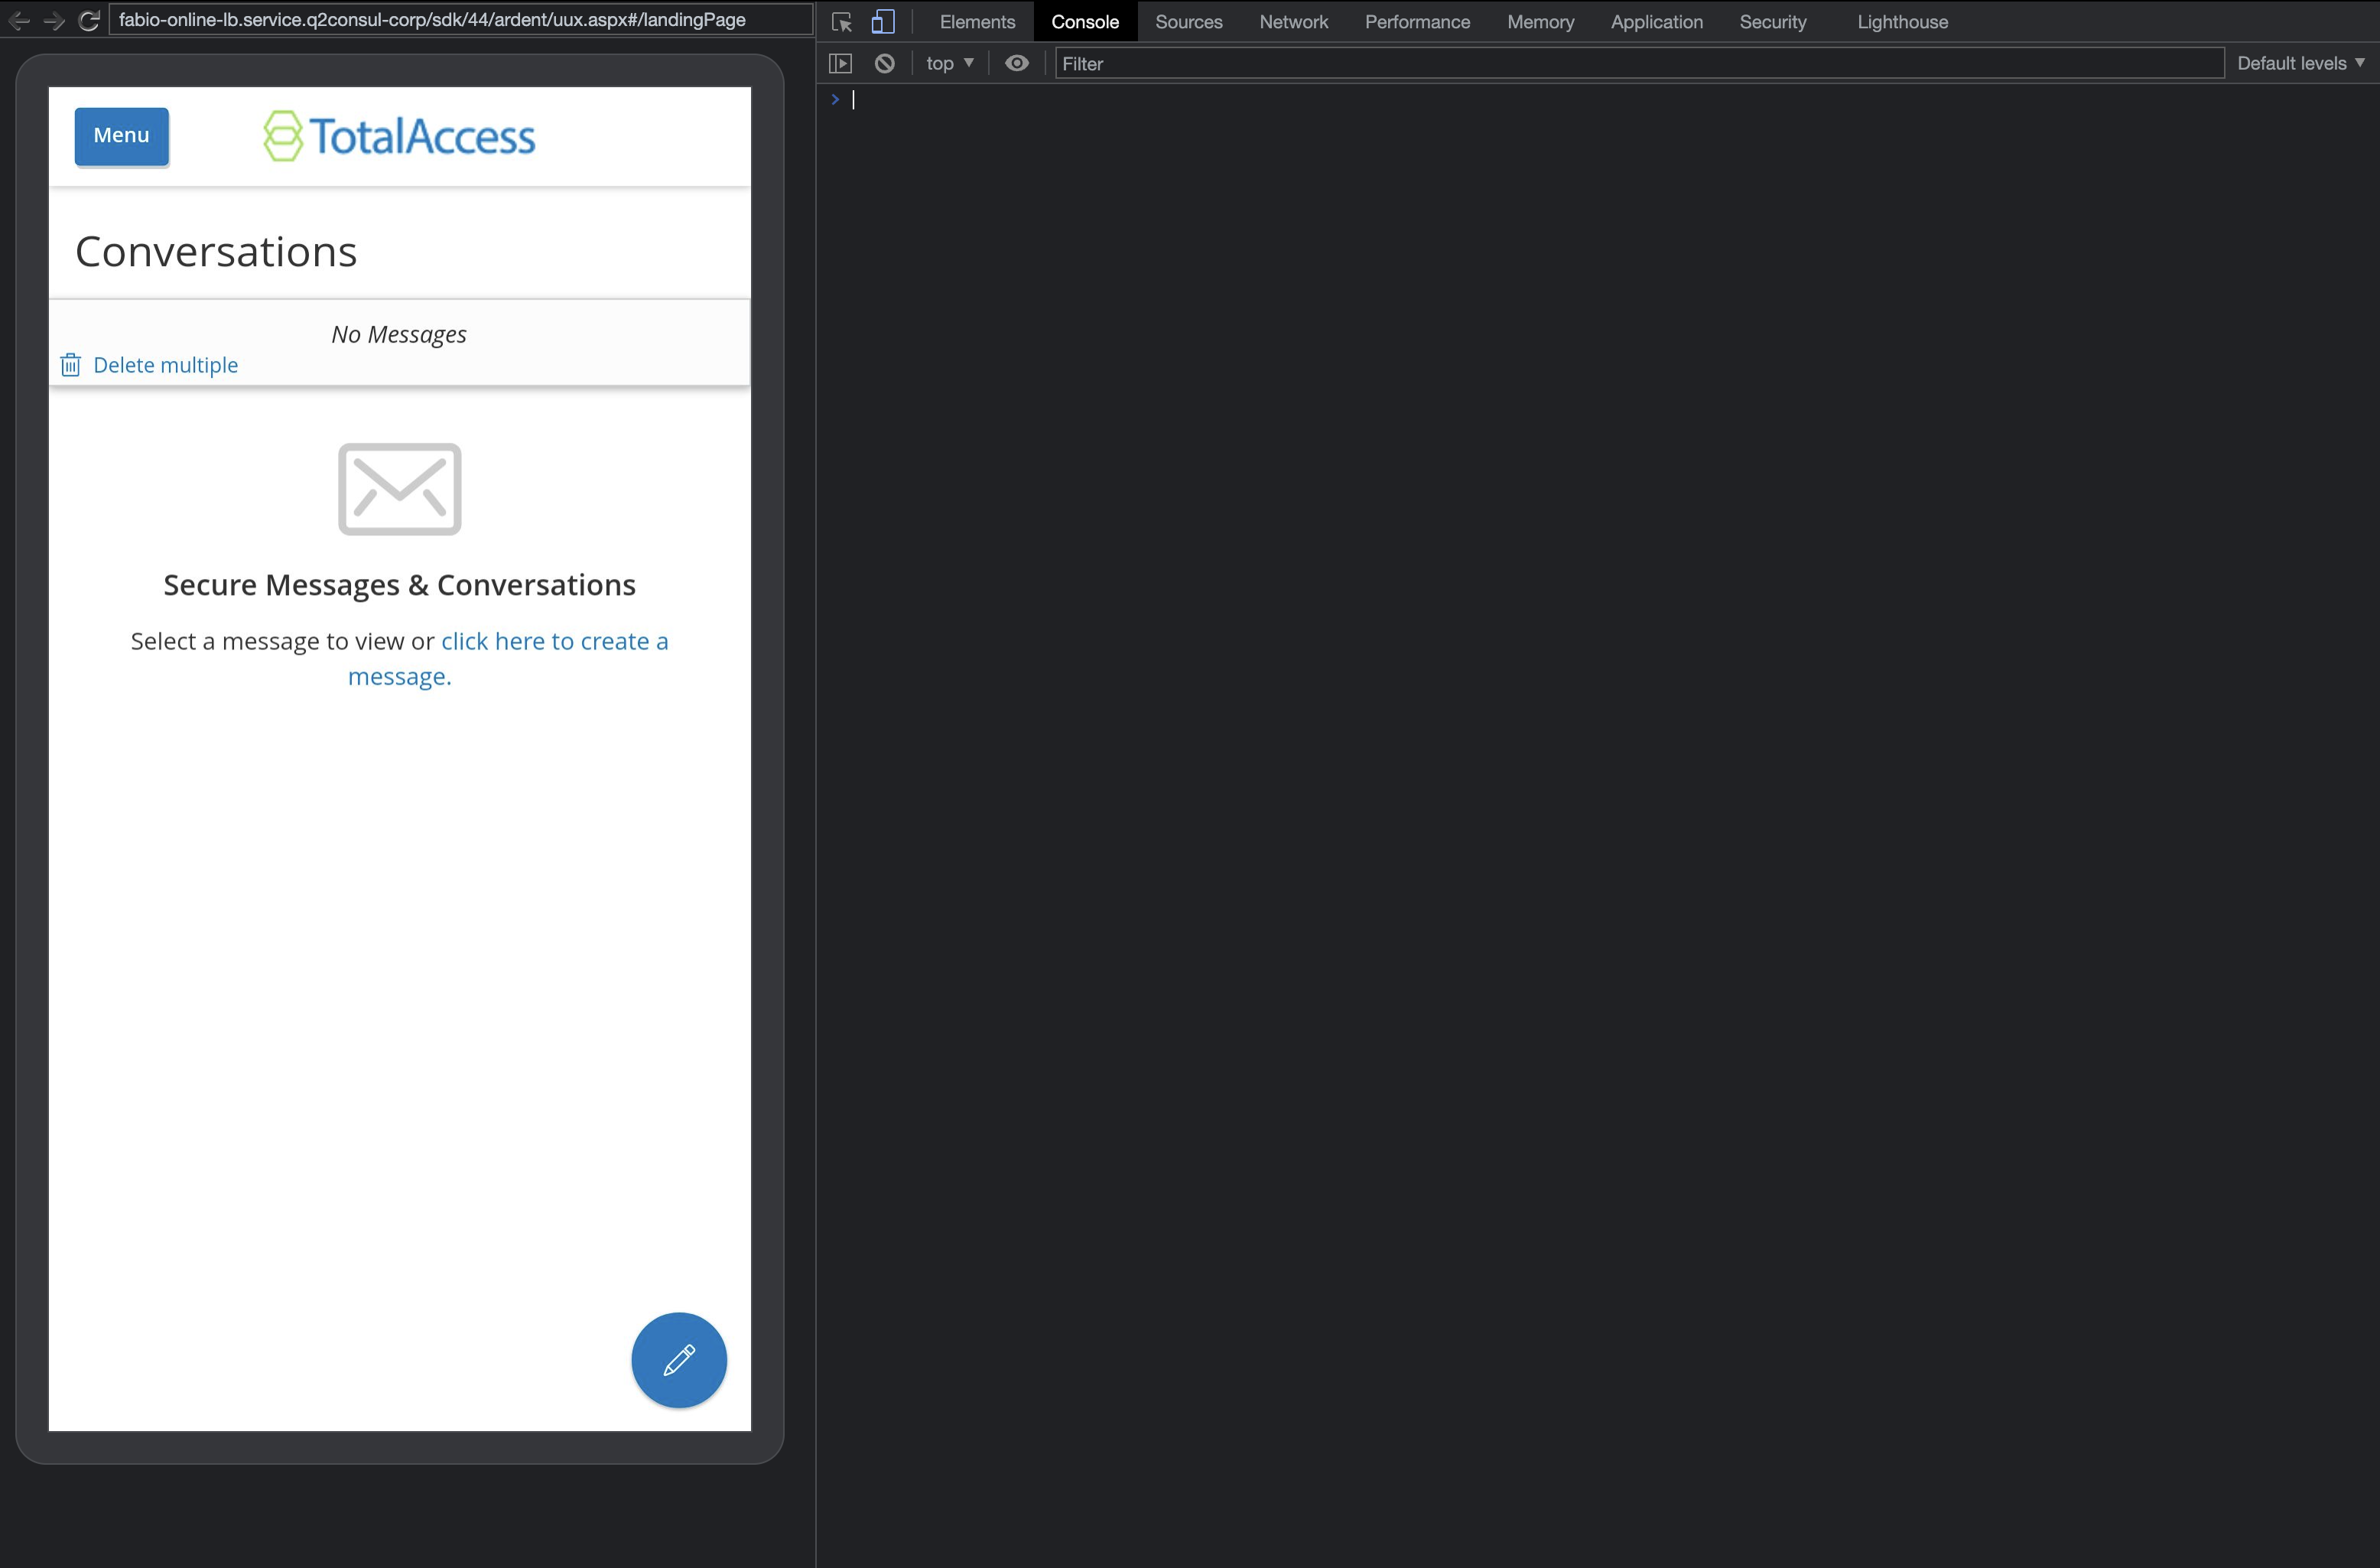
From here, you get access to several tabs. One of them being the console. This will output
any console.log from your javascript, so you can debug and step through your Tecton
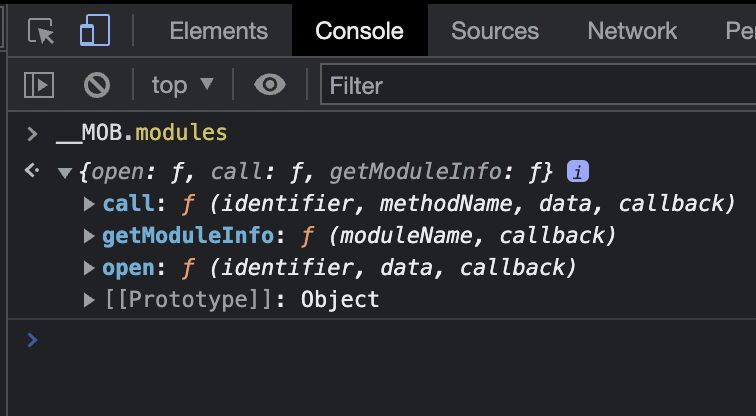
extension. You can also type in commands here to trigger specific events. For example, we
can see if the javascript bridge is working by typing __MOB.modules into the console.
This will display a list of module commands available to the webview. call is used to
trigger the MethodModules, and open triggers UIModules.
Debug Release Testing Builds
It is possible to see a discrepancy between a DevApp module and a
Release Testing Build. Most commonly, this comes down to issues with proguard rules,
apk/aar library imports, etc. To prevent these issues, make sure your
consumer-rules.pro file is properly configured (see the
Consumer ProGuard Rules Guide
for details). In cases where issues persist, we can provide a Debug Release Testing Build. This is the full release in most respects, but with minify and a handful of other
release settings disabled.
These builds are done manually, so if necessary please open a ticket on the Q2 Developer portal requesting one.